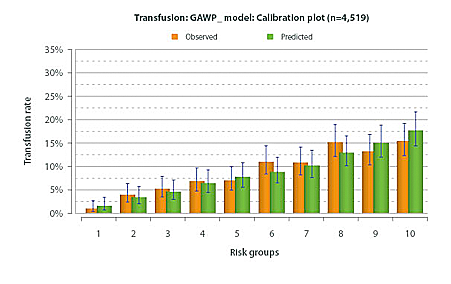
Risk scores must also provide an estimate of the risk both for individual patients and for groups of patients. One way to test this component of a risk score is to plot the observed number of events against the predicted number of events; this is termed a calibration plot. To simplify the procedure, the data can be split into groups, according to risk, and the observed and predicted outcome rates plotted side by side. If the model accurately predicts the outcome, the two should match closely.
Whilst, at first sight, the areas below the ROC curves suggest that including all five variables in the models would provide the best risk model, the calibration plots suggested otherwise. It was, therefore, decided to use gender, age, WHO performance status & procedure (GAWP_) to calculate the final risk-adjusted rates for each nephrectomy outcome, for each patient and, subsequently, for each hospital and Consultant. The final GAWP_ model calibration plots are shown below.
Table 6: Calibration plot for mortality
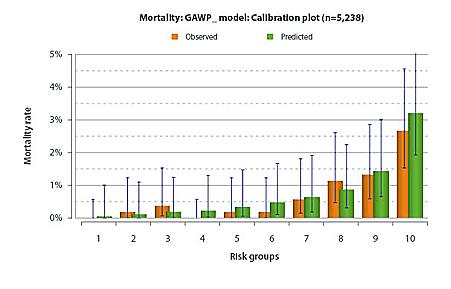
Table 7: Calibration plot for complications
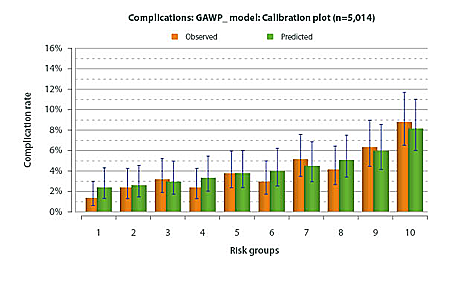
Table 8: Calibration plot for transfusion